XOSVIEW
NAMESYNOPSIS
DESCRIPTION
OPTIONS
X RESOURCES
OBTAINING
BUGS
AUTHORS
NAME
xosview − X based system monitor
SYNOPSIS
xosview [options]
DESCRIPTION
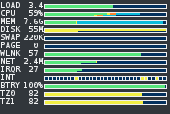
xosview is a program which displays the status of several system based parameters. These include CPU usage, load average, memory usage, swap space usage, network usage, interrupts, and serial port status and more. Each of these is displayed as a horizontal bar which is separated into color coded regions. Each region represents a percentage of the resource which is being put to a particular use. Typing a ’q’ in the window will terminate xosview.
At the moment xosview runs on eight platforms (Linux, NetBSD, FreeBSD, OpenBSD, some Solaris systems, IRIX 6.5, HPUX and GNU). Not all of the meters described below are supported on all platforms. Some of the meters may appear different depending upon the platform xosview is running on. Note that *BSD is used as an abbreviation for all three of the free BSD operating systems (NetBSD, FreeBSD, OpenBSD).
Load
all platforms : load
CPU
Usage
Linux : user | nice | system | iowat | irq | softirq |
stolen | guest | nice guest | idle
*BSD : user | nice | system | interrupt | idle
IRIX : user | system | interrupt | wait | idle
HPUX : user | nice | system | interrupt | idle
Memory
Usage
Linux : used | buffers | cached | swap cache | free
NetBSD : active | inactive | wired | free
FreeBSD: active | inactive | wired | buffer | free
OpenBSD: active | inactive | wired | free
IRIX : kernel | fs | user | free
HPUX : text | used | other | free
GNU : active | inactive | wired | free
Swap
Usage
all platforms except IRIX: used | free
Disk Usage
(bytes/sec)
Linux : in | out | idle
*BSD : transferred | idle
HPUX : < Not Supported >
Page
Swapping from/to disk
all platforms except IRIX : in | out | idle
NET
Usage
bytes/sec
Linux : in | out | idle
*BSD : in | out | idle
HPUX : < Not Supported >
GFX
Usage
swapbuffers/sec
IRIX : number of swapbuffers
Interrupts
"leds" which blink when an interrupt occurs.
Linux : IRQs 0 - 64 (per cpu if configured)
*BSD : IRQs 0 - 15 (or fewer, depending on architecture)
HPUX : < Not Supported >
Interrupt
rate
interrupts per second
Linux : interrupts | free
*BSD : interrupts | free
HPUX : < Not Supported >
Serial Port
Status
"leds" which show the serial port parameters.
Linux : Both the Line Status Register
(LSR) and Modem Status Register
(MSR) are displayed.
*BSD : < Not Supported >
HPUX : < Not Supported >
Battery
Level
Shows the current condition of the
battery (for laptops).
Linux : %left | %used
NetBSD : %left | %used
FreeBSD: < Not Supported >
OpenBSD: %left | %used
HPUX : < Not Supported >
RAID
status
Shows the state of disks contained in your (software)
RAID1/4/5 array(s) and the rebuild state of the
array(s).
Linux : Disk0 Disk1 Disk2 .. DiskN | Rebuild Progress
OPTIONS
Almost all of these command line options are just a convenient way to set one or more of xosview’s resources. All resouces set on the command line will override those specified anywhere else. Please see the RESOURCES section for more details on what the resource is for and for the overall scheme of how resource values are found.
--help, -h
Displays usage information to stdout and exits.
--version, -v
Displays the version information and exits.
--display, -display name
Sets the X display to name.
--title, -title name
This option sets the name xosview will tell the window manager to use for the X window and icon. This option overrides the xosview*title resource.
-geometry, -g geometry
Sets the X geometry to geometry_string. This option overrides the xosview*geometry resource.
--foreground, -fg color
The color to use for the foreground.
--background, -bg color
The color to use for the background.
-font, -fn fontName
Specifies the fontName xosview will use for labels. This option overrides the xosview*font resource. Not all fonts currently work well with xosview. For more details see the RESOURCES section.
--iconic, -iconic
Request to start in an iconic state.
--name, -name name
Sets the Resource name xosview will use (same as the -name option for typical X applications like xterm). When performing resource lookups, xosview will look under name, and then under ‘‘xosview’’.
-xrm, -x spec
This switch allows any of xosview’s resources to be set on the command line. An example of how the xosview*memFreeColor could be set using this option is shown below (Note the use of " to prevent the shell from expanding ´*´ or from creating two separate arguments, ´xosview*memfreeColor:´ and ´purple´):
-xrm "xosview*memFreeColor: purple"
--option, -o spec
This option is exactly the same as -xrm except that you do not need to specify an instance name (such as xosview*). It will be prepended for you. So, this will also set the xosview*memFreeColor to purple:
-o "memFreeColor: purple"
--config, -c fileName
Load an XResource file. This file will override (not replace) any previous resources. See the RESOURCES section for more details.
--xrm-dump, -xrmd
Dump the X resouces seen by xosview to stdout and exit. This will show a final list of all resources seen after loading and merging is finished.
X RESOURCES
The following is a list of X resources supported by xosview. Each has a default value assigned to it. These values can be found in the file Xdefaults which can be obtained in the source distribution of xosview. They can be overridden in the usual places (/usr/lib/X11/app-defaults/XOsview, $HOME/.Xdefaults, etc.).
It should be noted that it is OK to have a resource defined for a port of xosview that does not support the feature the resource configures. Xosview will simply ignore the resources that are set for it but not supported on a given platform.
The resouces used by xosview are located and loaded in the following order. Each layer overrides the previous. And, of course, the best match is used. For example ".xosview*font" overrides the more generic "*font".
From first loaded/searched to last:
|
1 |
An embeded copy of Xdefaults used to build xosview. So, xosview always has a default and complete set of resources even if all other options fail. | ||
|
2 |
Standard X11 search paths and mechanics (XAPPLRESDIR, .Xdefault, xmodmap, etc). For full details see the X documentation. The following is a short summary: |
•
|
From the class file (XOsview) found in the app-defaults directory configured into xosview at compile time. | |||
|
• |
From the class file (XOsview) in the XAPPLRESDIR (environment variable). | ||
|
• |
From resources loaded onto the Display of the X server (by xrdb for example). | ||
|
• |
From resources loaded onto the Screen of the Display (again by xrdb or the like). | ||
|
• |
From the .Xdefaults file in the users HOME (environment variable) directory. Xosview loads this file even if your X session did not. | ||
|
• |
From resources found in the file specified by the XENVIRONMENT environment variable. | ||
|
3 |
Resource files specified by the -c, --config command line arguments
|
4 |
Resources set by using the -xrm command line argument(s). | ||
|
5 |
Command line options (such as -display) that set resources. |
Note that since xosview always starts off with a complete set of resources it needs then you only need specify those options you would like to change from their default values. For example your .Xdefaults file could simply contain the line "xosview*background: blue" if all you wish is an "stock" xosview with a blue background.
General Resources
xosview*title: name
The string that xosview will use for the X window title. Normally xosview will use ’xosview@machine_name’ for a title. This resource overrides the default behavior.
xosview*geometry: geometry_string
This is a standard X geometry string that defines the size and location of the X window used by xosview.
xosview*display: name
The name of the display where xosview will contact the X server for drawing its window.
xosview*pixmapName: name
The filename of an X pixmap (xpm) file for use as a background image.
xosview*transparent: (True or False)
If True set the window background to transparent. EXPERIMENTAL.
xosview*captions: (True or False)
If True then xosview will display meter captions.
xosview*labels: (True or False)
If True then xosview will display meter labels.
xosview*meterLabelColor: color
The color to use for the meter labels.
xosview*usedlabels: (True or False)
If True then xosview will display labels that show the percentage of the resource (or absolute amount, depending on the meter) being used. This option requires that the labels option also be set to True.
xosview*usedLabelColor: color
The color to use for "used" labels.
xosview*font: font
This is the font that xosview will use. Currently the xosview text rendering code assumes that a mono spaced (fixed width) font. So, things will most likely look poor with a non mono spaced font. If the build system supports Xft then xosview will switch to using freetype2 fonts. Otherwise core X11 fonts are used.
xosview*background: color
This is the color that will be used for the background.
xosview*foreground: color
This is the color that will be used for the foreground.
xosview*enableStipple: (True or False)
Change to true to try stipple support. This is primarily for users stuck with 1-bit monitors/display cards. Try setting enableStipple true. Please give us feedback on this, if you use it. It needs some more work, but no one has given us any feedback so far.
xosview*graphNumCols: number
This defines the number of sample bars drawn when a meter is in scrolling graph mode. This also has the side-effect of defining the width of the graph columns. This is only used by meters which have graph mode enabled.
Load Meter Resources
xosview*load: (True or False)
If True then xosview will display a load meter.
xosview*loadWarnColor: color
This is the color that the load meter will use once the load average is greater than the loadWarnThreshold.
xosview*loadCritColor: color
This is the color that the load meter will use once the load average is greater than the loadCritThreshold (peaked).
xosview*loadProcColor: color
This is the color that the load meter will use to display the load average when it is less than the loadWarnThreshold.
xosview*loadIdleColor: color
The load meter will use this color to display the idle field.
xosview*loadPriority: priority
This number (which must be an integer >= 1) sets the number of tenths of a second that the load meter waits between updates. A value of 1 has xosview update the meter 10 times per second (the fastest). A value of 600 would cause xosview to update the meter once a minute.
xosview*loadWarnThreshold: int
This number (which must be an integer >= 1) sets the value at which the loadmeter changes its status and color from "normal" to "alarm". The default value is 2.
xosview*loadCritThreshold: int
This number (which must be an integer >= 1) sets the value at which the loadmeter changes its status and color from "normal" to "alarm". It is also the value that will be used for the peak of the meter. The meter will still show the total load in the used level when peaked.
xosview*loadDecay: (True or False)
You should probably leave this at the default value (False). The load is already a time-averaged value!
xosview*loadGraph: (True or False)
If this is set to True then the load meter will be drawn as a horizontally scrolling bargraph showing the state value verses time.
xosview*loadUsedFormat: (float, percent or autoscale)
This resource tells xosview how to display "used" labels. The formats work as follows:
float:
Display the value as a floating point number.
percent:
Display the value as a percentage of the total.
autoscale:
Display the absolute value and automatically print the units (K, M, or G) as appropriate.
xosview*loadCpuSpeed: (True or False)
Display the current CPU speed in the load meter.
CPU Meter Resources
xosview*cpu: (True or False)
If True then xosview will display a cpu meter. On 1 or IRIX 6.5 SMP machines, the resource cpuFormat decides which meters are created for multiple CPUs.
xosview*cpuUserColor: color
The cpu meter will use this color to display the cpu user time field.
xosview*cpuNiceColor: color
The cpu meter will use this color to display the cpu nice time field.
xosview*cpuSystemColor: color
The cpu meter will use this color to display the cpu system time field.
xosview*cpuWaitColor: color
The cpu meter will use this color to display the cpu IO wait time field.
xosview*cpuInterruptColor: color
The cpu meter will use this color to display the cpu IRQ time field.
xosview*cpuSoftIntColor: color
The cpu meter will use this color to display the cpu soft IRQ time field.
xosview*cpuStolenColor: color
The cpu meter will use this color to display the cpu time spent in host OS field.
xosview*cpuGuestColor: color
The cpu meter will use this color to display the cpu time spent on guest cpu field.
xosview*cpuNiceGuestColor: color
The cpu meter will use this color to display the cpu time spent on niced guest cpu field.
xosview*cpuFreeColor: color
The cpu meter will use this color to display the cpu idle time field.
xosview*cpuPriority: priority
This number (which must be an integer >= 1) sets the number of tenths of a second that the cpu meter waits between updates. A value of 1 has xosview update the meter 10 times per second (the fastest). A value of 600 would cause xosview to update the meter once a minute.
xosview*cpuDecay: (True or False)
If True then the cpu meter will be split vertically in two. The top half will show the instantaneous state, while the bottom half will display a decaying average of the state.
xosview*cpuGraph: (True or False)
If this is set to True then the cpu meter will be drawn as a horizontally scrolling bargraph showing the state value verses time.
xosview*cpuUsedFormat: (float, percent or autoscale)
This resource tells xosview how to display "used" labels. The formats work as follows:
float:
Display the value as a floating point number.
percent:
Display the value as a percentage of the total.
autoscale:
Display the absolute value and automatically print the units (K, M, or G) as appropriate.
xosview*cpuUsedDecay: (True or False)
If True then xosview will display the used labels as an average over the last N samples. N is a vague number set at the factory. It reduces the text drawing load on the X server.
Memory Meter Resources
xosview*mem: (True or False)
If True then xosview will display a mem meter.
xosview*memUsedColor: color
The mem meter will use this color to display the used memory field.
xosview*memBufferColor: color
The mem meter will use this color to display the buffer memory field.
xosview*memCacheColor: color
The mem meter will use this color to display the cache memory field.
xosview*memSwapCacheColor: color
The mem meter will use this color to display the cache memory that has been swaped once field.
xosview*memFreeColor: color
The mem meter will use this color to display the free memory field.
xosview*memTextColor: color
The mem meter will use this color to display the HP text memory field.
xosview*memOtherColor: color
The mem meter will use this color to display the HP ‘‘other’’ memory field.
xosview*memActiveColor: color
The mem meter will use this color to display the NetBSD active memory field.
xosview*memInactiveColor: color
The mem meter will use this color to display the NetBSD inactive memory field.
xosview*memPriority: priority
This number (which must be an integer >= 1) sets the number of tenths of a second that the mem meter waits between updates. A value of 1 has xosview update the meter 10 times per second (the fastest). A value of 600 would cause xosview to update the meter once a minute.
xosview*memDecay: (True or False)
If True then the mem meter will be split vertically in two. The top half will show the instantaneous state, while the bottom half will display a decaying average of the state.
xosview*memGraph: (True or False)
If this is set to True then the mem meter will be drawn as a horizontally scrolling bargraph showing the state value verses time.
xosview*memUsedFormat: (float, percent or autoscale)
This resource tells xosview how to display "used" labels. The formats work as follows:
float:
Display the value as a floating point number.
percent:
Display the value as a percentage of the total.
autoscale:
Display the absolute value and automatically print the units (K, M, or G) as appropriate.
Swap Meter Resources
xosview*swap: (True or False)
If True then xosview will display a swap meter.
xosview*swapUsedColor: color
The swap meter will use this color to display the used swap field.
xosview*swapFreeColor: color
The swap meter will use this color to display the free swap field.
xosview*swapPriority: priority
This number (which must be an integer >= 1) sets the number of tenths of a second that the swap meter waits between updates. A value of 1 has xosview update the meter 10 times per second (the fastest). A value of 600 would cause xosview to update the meter once a minute.
xosview*swapDecay: (True or False)
If True then the swap meter will be split vertically in two. The top half will show the instantaneous state, while the bottom half will display a decaying average of the state.
xosview*swapGraph: (True or False)
If this is set to True then the swap meter will be drawn as a horizontally scrolling bargraph showing the state value verses time.
xosview*swapUsedFormat: (float, percent or autoscale)
This resource tells xosview how to display "used" labels. The formats work as follows:
float:
Display the value as a floating point number.
percent:
Display the value as a percentage of the total.
autoscale:
Display the absolute value and automatically print the units (K, M, or G) as appropriate.
xosview*swapUsedDecay: (True or False)
If True then xosview will display the used labels as an average over the last N samples. N is a vague number set at the factory. It reduces the text drawing load on the X server.
IRQ rate Meter Resources
xosview*irqrate: (True or False)
If True then xosview will display a irqrate meter.
xosview*irqrateUsedColor: color
The irqrate meter will use this color to display the used irq rate field.
xosview*irqrateFreeColor: color
The irqrate meter will use this color to display the free irq rate field.
xosview*irqratePriority: priority
This number (which must be an integer >= 1) sets the number of tenths of a second that the irqrate meter waits between updates. A value of 1 has xosview update the meter 10 times per second (the fastest). A value of 600 would cause xosview to update the meter once a minute.
xosview*irqratePeak: peakIRQRate
This number is the peak value for the field meter in irq/sec. The used label will still report values over this peak.
xosview*irqrateUsedFormat: (float, percent or autoscale)
This resource tells xosview how to display "used" labels. The formats work as follows:
float:
Display the value as a floating point number.
percent:
Display the value as a percentage of the total.
autoscale:
Display the absolute value and automatically print the units (K, M, or G) as appropriate.
xosview*irqrateUsedDecay: (True or False)
If True then xosview will display the used labels as an average over the last N samples. N is a vague number set at the factory. It reduces the text drawing load on the X server.
xosview*irqrateDecay: (True or False)
If True then the irqrate meter will be split vertically in two. The top half will show the instantaneous state, while the bottom half will display a decaying average of the state.
xosview*irqrateGraph: (True or False)
If this is set to True then the irqrate meter will be drawn as a horizontally scrolling bargraph showing the state value verses time.
Page Swapping Meter Resources
xosview*page: (True or False)
If True then xosview will display a page meter.
xosview*pageBandWidth: maxEvents
This number is used to specify the expected maximum bandwidth (in events / sec) for the page meter. When the expected maximum bandwidth (maxEvents) is exceeded then the page meter will display the relative percentage of page swapping (25% in, 75% out).
xosview*pageInColor: color
The page meter will use this color to display the page-in field.
xosview*pageOutColor: color
The page meter will use this color to display the page-out field.
xosview*pageIdleColor: color
The page meter will use this color to display the idle field.
xosview*pagePriority: priority
This number (which must be an integer >= 1) sets the number of tenths of a second that the page meter waits between updates. A value of 1 has xosview update the meter 10 times per second (the fastest). A value of 600 would cause xosview to update the meter once a minute.
xosview*pageDecay: (True or False)
If True then the page meter will be split vertically in two. The top half will show the instantaneous state, while the bottom half will display a decaying average of the state.
xosview*pageGraph: (True or False)
If this is set to True then the page meter will be drawn as a horizontally scrolling bargraph showing the state value verses time.
xosview*pageUsedFormat: (float, percent or autoscale)
This resource tells xosview how to display "used" labels. The formats work as follows:
float:
Display the value as a floating point number.
percent:
Display the value as a percentage of the total.
autoscale:
Display the absolute value and automatically print the units (K, M, or G) as appropriate.
xosview*pageUsedDecay: (True or False)
If True then xosview will display the used labels as an average over the last N samples. N is a vague number set at the factory. It reduces the text drawing load on the X server.
Gfx Meter Resources
xosview*gfx: (True or False)
If True xosview will display the GfxMeter. The value is sampled once per second, due to the usage of sadc to sample data.
xosview*gfxWarnColor: color
This is the color that the gfx meter will use once the warn state is reached.
xosview*gfxAlarmColor: color
This is the color that the gfx meter will use once the alarm state is reached.
xosview*gfxSwapColor: color
This is the color that the gfx meter will use in normal state
xosview*gfxIdleColor: color
The gfx meter will use this color to display the idle field.
xosview*gfxPriority: priority
This number (which must be an integer >= 1) sets the number of tenths of a second that the gfx meter waits between updates. A value of 1 has xosview update the meter 10 times per second (the fastest). A value of 600 would cause xosview to update the meter once a minute.
xosview*gfxWarnThreshold: int
This number (which must be an integer >= 1) of swapbuffers per second and pipe at which the gfxmeter changes its status and color from "normal" to "warn". The default value is 60.
xosview*gfxAlarmThreshold: int
This number (which must be an integer >= gfxWarnThreshold) of swapbuffers per second and pipe at which the gfxmeter changes its status and color from "warn" to "alarm". The default value is 120.
xosview*gfxDecay: (True or False)
You should probably leave this at the default value (False). The gfx does not work in decay mode.
xosview*gfxGraph: (True or False)
If this is set to True then the gfx meter will be drawn as a horizontally scrolling bargraph showing the state value verses time.
xosview*gfxUsedFormat: (float, percent or autoscale)
This resource tells xosview how to display "used" labels. The formats work as follows:
float:
Display the value as a floating point number.
percent:
Display the value as a percentage of the total.
autoscale:
Display the absolute value and automatically print the units (K, M, or G) as appropriate.
Wireless Link Meter Resouces
xosview*wlink: (True or False)
If True then xosview will
display a wlink meter.
This meter shows wireless link quality. What is quality you
might ask? It is a number between zero and 70. Beyond that
you are on your own. Anway Linux systems will display this
value and let you set a warning threshold when it is
"low". If this meter is enabled and no wireless
connections exists it will just sit there and display
zero.
xosview*wlinkBackground: color
The color to use to display the background area of the meter.
xosview*wlinkGoodColor: color
The color to use for the display of the link value when it is above the wlinkPoorValue threshold.
xosview*wlinkPoorColor: color
The color to use for the display of the link value when it is below the linkPoorValue threshold.
xosview*wlinkPoorValue: value
The threshold value to use to switch between wlinkGoodColor and wlinkPoorColor.
xosview*wlinkPriority: priority
This number (which must be an integer >= 1) sets the number of tenths of a second that the wlink meter waits between updates. A value of 1 has xosview update the meter 10 times per second (the fastest). A value of 600 would cause xosview to update the meter once a minute.
xosview*wlinkDecay: (True or False)
If True then the wlink meter will be split vertically in two. The top half will show the instantaneous state, while the bottom half will display a decaying average of the state.
xosview*wlinkGraph: (True or False)
If this is set to True then the wlink meter will be drawn as a horizontally scrolling bargraph showing the state value verses time.
xosview*wlinkUsedFormat: (float, percent or autoscale)
This resource tells xosview how to display "used" labels. The formats work as follows:
float:
Display the value as a floating point number.
percent:
Display the value as a percentage of the total.
autoscale:
Display the absolute value and automatically print the units (K, M, or G) as appropriate.
xosview*wlinkUsedDecay: (True or False)
If True then xosview will display the used labels as an average over the last N samples. N is a vague number set at the factory. It reduces the text drawing load on the X server.
Network Meter Resources
xosview*net: (True or False)
If True xosview will display the NetMeter. Linux users will have to configure their kernels and setup some ip accounting rules to make this work. See the file README. 1 which comes with the xosview distribution for details.
xosview*netBandwidth: maxBytes
This number is used to specify the expected maximum bandwidth (in bytes / sec) for the meter. When the expected maximum bandwidth (maxBytes) is exceeded then the network meter will display the relative percentage of network usage (25% incomming, 75% outgoing).
xosview*netIface: interface
If False, xosview will display the data received/transmitted by any of the network interfaces. Otherwise, xosview will only display the data received/transmitted by the specified network interface.
xosview*netInColor: color
The net meter will use this color to display the incoming field.
xosview*netOutColor: color
The net meter will use this color to display the outgoing field.
xosview*netBackground: color
This is the color that the network meter will use for the "idle" field.
xosview*netPriority: priority
This number (which must be an integer >= 1) sets the number of tenths of a second that the net meter waits between updates. A value of 1 has xosview update the meter 10 times per second (the fastest). A value of 600 would cause xosview to update the meter once a minute.
xosview*netDecay: (True or False)
If True then the net meter will be split vertically in two. The top half will show the instantaneous state, while the bottom half will display a decaying average of the state.
xosview*netGraph: (True or False)
If this is set to True then the net meter will be drawn as a horizontally scrolling bargraph showing the state value verses time.
xosview*netUsedFormat: (float, percent or autoscale)
This resource tells xosview how to display "used" labels. The formats work as follows:
float:
Display the value as a floating point number.
percent:
Display the value as a percentage of the total.
autoscale:
Display the absolute value and automatically print the units (K, M, or G) as appropriate.
xosview*netUsedDecay: (True or False)
If True then xosview will display the used labels as an average over the last N samples. N is a vague number set at the factory. It reduces the text drawing load on the X server.
NFSStats (Client) Resources
xosview*NFSStats: (True or False)
If True then xosview will display a meter to monitor NFS client stats.
xosview*NFSStatReTransColor: color
The color to be used for retransmit stats.
xosview*NFSStatAuthRefrshColor: color
The color to be used for auth refresh stats.
xosview*NFSStatCallsColor: color
The color to be used for call stats.
xosview*NFSStatIdleColor: color
The color to be used for idle stats.
NFSDStats (Server) Resources
xosview*NFSDStats: (True or False)
If True xosview will display a meter for NFS server/daemon stats.
xosview*NFSDStatCallsColor: color
The color to be used for call stats.
xosview*NFSDStatBadCallsColor: color
The color to be used for bad stats.
xosview*NFSDStatUDPColor: color
The color to be used for UDP stats.
xosview*NFSDStatTCPColor: color
The color to be used for TCP stats.
xosview*NFSDStatIdleColor: color
The color to be used for idle stats.
xosview*NFSDStatUsedFormat: (float, percent or autoscale)
This resource tells xosview how to display "used" labels. The formats work as follows:
float:
Display the value as a floating point number.
percent:
Display the value as a percentage of the total.
autoscale:
Display the absolute value and automatically print the units (K, M, or G) as appropriate.
xosview*NFSDStatUsedDecay: (True or False)
If True then xosview will display the used labels as an average over the last N samples. N is a vague number set at the factory. It reduces the text drawing load on the X server.
Serial Meter Resources
xosview*serial(0-9): (True, False, or portBase)
If True then xosview will display a serial meter for ttySx. The portbase will be autodetected. Because autodetection can fail, (if the port is locked by ppp/slip for example) you can specify the portbase instead of "True". If a portBase is used then xosview will use it instead of trying to autodetect.
For this to work on Linux xosview needs to be suid root in order to have access to the ports. See the file README. 1 which comes with the xosview distribution for more details.
xosview*serialOnColor: color
This is the color the serial meter will use for bits that are set.
xosview*serialOffColor: color
This is the color the serial meter will use for bits that are not set.
xosview*serialPriority: priority
This number (which must be an integer >= 1) sets the number of tenths of a second that the serial meter waits between updates. A value of 1 has xosview update the meter 10 times per second (the fastest). A value of 600 would cause xosview to update the meter once a minute.
Interrupt Meter Resources
xosview*interrupts: (True or False)
If True then xosview will display an interrupt meter.
xosview*intOnColor: color
This is the color that will be used to show "active" interrupts.
xosview*intOffColor: color
This is the color that will be used to show "inactive" interrupts.
xosview*intFormat: (single, all, both or auto)
Linux only.
If single, only a cumulative meter for all CPU is created.
All creates a meter for each CPU, but no cumulative meter.
Both creates one cumulative meter and one per cpu. auto
behaves like single on uniprocessor system, and like both on
multiprocessor systems.
xosview*intPriority: priority
This number (which must be an integer >= 1) sets the number of tenths of a second that the int meter waits between updates. A value of 1 has xosview update the meter 10 times per second (the fastest). A value of 600 would cause xosview to update the meter once a minute.
Thermal Zone Resources
Linux supports WAY TOO MANY ways to read temperature. This is yet another one. It was my hope to read the hot and critical thermal trip points out of /sys directly. But based on my tests (with a sample size of two) this is inconsistant. So, this meter supports configuratble values that are shared by all thermal zones.
xosview*tzone: (True or False)
If True then xosview will
display a tzone meter.
Enabling this creates a seperate meter for each thermal zone
found.
xosview*tzoneForeGround: color
The foreground color for temperatues below the hotTrip point.
xosview*tzoneBackground: color
The background color.
xosview*tzoneHotColor: color
The foreground color for temperatues over the hotTrip point and under the critTrip point.
xosview*tzoneCritColor: color
The foreground color for temperatues over the critTrip point.
xosview*tzoneHotTrip: value
The temperature (in degrees C) to start displaying in the hot color.
xosview*tzoneCritTrip: value
The temperature (in degrees C) to start displaying in the crit color.
xosview*tzonePeak: value
The value to use as a max for the meters. Note that the used legends will still report the value read from /sys even if the graphical display hits this peak.
xosview*tzonePriority: priority
This number (which must be an integer >= 1) sets the number of tenths of a second that the tzone meter waits between updates. A value of 1 has xosview update the meter 10 times per second (the fastest). A value of 600 would cause xosview to update the meter once a minute.
xosview*tzoneDecay: (True or False)
If True then the tzone meter will be split vertically in two. The top half will show the instantaneous state, while the bottom half will display a decaying average of the state.
xosview*tzoneGraph: (True or False)
If this is set to True then the tzone meter will be drawn as a horizontally scrolling bargraph showing the state value verses time.
xosview*tzoneUsedFormat: (float, percent or autoscale)
This resource tells xosview how to display "used" labels. The formats work as follows:
float:
Display the value as a floating point number.
percent:
Display the value as a percentage of the total.
autoscale:
Display the absolute value and automatically print the units (K, M, or G) as appropriate.
xosview*tzoneUsedDecay: (True or False)
If True then xosview will display the used labels as an average over the last N samples. N is a vague number set at the factory. It reduces the text drawing load on the X server.
Lm Sensors Temperature Resources
xosview*lmstemp: (True or False)
If True then xosview will display a lmstemp meter.
xosview*lmstempHighest: 100
Highest temp value displayed, default 100.
xosview*lmstempActColor: color
Color of actual temperature.
xosview*lmstempHighColor: color
Color above alarm temperature, also used to indicate alarm.
xosview*lmstempIdleColor: color
Color between actual and alarm temperatures.
xosview*lmstempN: filename
Name of temperature file from
/proc/sys/dev/sensors/$*/$*, N=1..
Note if more files with same name exists, only the first is
found. There is currently no possiblity to configure equal
named files on different busses (which would be rarely
necessary, I hope).
eg.
xosview*lmstemp1: temp xosview*lmstemp2: remote_temp
xosview*lmstempLabelN: Labelstring
N-th label for above temperatures, default is TMP.
xosview*lmstempPriority: priority
This number (which must be an integer >= 1) sets the number of tenths of a second that the lmstemp meter waits between updates. A value of 1 has xosview update the meter 10 times per second (the fastest). A value of 600 would cause xosview to update the meter once a minute.
xosview*lmstempUsedFormat: (float, percent or autoscale)
This resource tells xosview how to display "used" labels. The formats work as follows:
float:
Display the value as a floating point number.
percent:
Display the value as a percentage of the total.
autoscale:
Display the absolute value and automatically print the units (K, M, or G) as appropriate.
Intel Core / AMD K8+ / VIA C7 Temperature Sensor Resources
xosview*coretemp: (True or False)
If True then xosview will display a coretemp meter.
xosview*coretempHighest: 100
Highest temp value displayed, default 100. If CPU throttling temperature (tjMax) is supplied by the operating system, it is used instead.
xosview*coretempHigh: number
Value to use as alarm temperature, default is coretempHighest. If a usable value, such as the temperature for which maximum cooling is required, is supplied by the operating system, it is used instead.
xosview*coretempActColor: color
Color of actual temperature.
xosview*coretempHighColor: color
Color above alarm temperature, also used to indicate alarm.
xosview*coretempIdleColor: color
Color between actual and alarm temperatures.
xosview*coretempDisplayType: (separate, average or maximum)
This resource tells xosview how to display the CPU temperature. The formats work as follows:
separate:
Display one meter for each CPU core of a multi-core CPU. This is the default.
average:
Display the average of core temperatures of a multi-core CPU. On multi-socket machines, one meter per physical CPU is displayed.
maximum:
Display the highest core temperature of a multi-core CPU. On multi-socket machines, one meter per physical CPU is displayed.
xosview*coretempPriority: priority
This number (which must be an integer >= 1) sets the number of tenths of a second that the coretemp meter waits between updates. A value of 1 has xosview update the meter 10 times per second (the fastest). A value of 600 would cause xosview to update the meter once a minute.
xosview*coretempUsedFormat: (float, percent or autoscale)
This resource tells xosview how to display "used" labels. The formats work as follows:
float:
Display the value as a floating point number.
percent:
Display the value as a percentage of the total.
autoscale:
Display the absolute value and automatically print the units (K, M, or G) as appropriate.
*BSD Sensor Resources
xosview*bsdsensor: (True or False)
If True then xosview will display a bsdsensor meter.
xosview*bsdsensorHighest: number
Highest value displayed. If not given, or too small, the meter will adjust to fit actual and alarm values. Can be overridden for any meter with bsdsensorHighestN.
xosview*bsdsensorActColor: color
Color of actual value.
xosview*bsdsensorHighColor: color
Color above high alarm value, also used to indicate alarm.
xosview*bsdsensorLowColor: color
Color of actual value, when it is below low alarm value.
xosview*bsdsensorIdleColor: color
Color between actual and high alarm values.
xosview*bsdsensorN:
name.type
xosview*bsdsensorHighN: name.type
xosview*bsdsensorLowN: name.type
These define where the actual value, high alarm value and low alarm value for meter N=1,2,3,... will be read from. The name is the sensor driver, and type is the wanted value. Both alarm values are optional, and can also be given as static numerical values.
You can find
the correct pair for OpenBSD and DragonFly BSD with systat
command, e.g.
xosview*bsdsensor1: it0.temp1
xosview*bsdsensorHigh1: 100
On NetBSD, you
can find the driver name with envstat command. Value name
for the actual reading is typically ’cur-value’
and for high alarm ’critical-max’ and for low
alarm ’critical-min’, e.g.
xosview*bsdsensor2: coretemp0.cur-value
xosview*bsdsensorHigh2: coretemp0.critical-max
For all possible NetBSD value names, refer to envstat source code.
FreeBSD has no
usable sensor drivers as of version 9.0. However, ACPI
thermal zones can be used by defining the sysctl node below
hw.acpi.thermal, e.g.
xosview*bsdsensor1: tz0.temperature
xosview*bsdsensorHigh1: tz0._CRT
ACPI thermal zones can be used like this on DragonFly BSD as well.
xosview*bsdsensorLabelN: string
N-th label for above meters, default is SENN.
xosview*bsdsensorHighestN: number
Override default bsdsensorHighest for meter N.
xosview*bsdsensorUsedFormatN: (float, percent or autoscale)
Override default bsdsensorUsedFormat for meter N.
xosview*bsdsensorPriority: priority
This number (which must be an integer >= 1) sets the number of tenths of a second that the bsdsensor meter waits between updates. A value of 1 has xosview update the meter 10 times per second (the fastest). A value of 600 would cause xosview to update the meter once a minute.
xosview*bsdsensorUsedFormat: (float, percent or autoscale)
This resource tells xosview how to display "used" labels. The formats work as follows:
float:
Display the value as a floating point number.
percent:
Display the value as a percentage of the total.
autoscale:
Display the absolute value and automatically print the units (K, M, or G) as appropriate.
Battery Meter Resources
xosview*battery: (True or False)
If True then xosview will display a battery meter. Linux users will need to have APM or ACPI support in their kernels for this to work. For both, APM and ACPI xosview shows the status/sum of all batteries. Additionally - the legend text gets changed/adjusted to reflect the current state (charging/low/critical/etc.) of the battery/batteries.
xosview*batteryLeftColor: color
This is the color that will be used to show the amount of battery power left.
xosview*batteryUsedColor: color
This is the color that will be used to show the amount of battery power used.
xosview*batteryChargeColor: color
This is the color that will be used as ’left’ - if the batteries get charged.
xosview*batteryFullColor: color
This is the color that will be used as ’left’ - if the batteries are fully charged. APM and ACPI does provide this info, but not all machines actually do so.
xosview*batteryLowColor: color
APM only - the ’left’ color that will indicate a low battery. Depends on the machine - e.g. below 25% remaining capacity.
xosview*batteryCritColor: color
APM case: the ’left’ color if APM indicates ’critical’ state. (less than 5%)
ACPI case: the ’left’ color if the remaining capacity is below the alarm value. (which can be set by the user in /proc/acpi/battery/BAT[01]/alarm )
xosview*batteryNoneColor: color
If no battery is present - or all batteries get removed (while on AC).
xosview*batteryPriority: priority
This number (which must be an integer >= 1) sets the number of tenths of a second that the battery meter waits between updates. A value of 1 has xosview update the meter 10 times per second (the fastest). A value of 600 would cause xosview to update the meter once a minute.
xosview*batteryUsedFormat: (float, percent or autoscale)
This resource tells xosview how to display "used" labels. The formats work as follows:
float:
Display the value as a floating point number.
percent:
Display the value as a percentage of the total.
autoscale:
Display the absolute value and automatically print the units (K, M, or G) as appropriate.
Disk Meter Resources
xosview*disk: (True or False)
If True then xosview will display a disk meter.
xosview*diskUsedColor: color
The disk meter will use this color to display the bytes transferred (in or out) field.
xosview*diskIdleColor: color
The disk meter will use this color to display the idle field.
xosview*diskBandwidth: bandwidth
This number is used to specify the expected maximum bandwidth in bytes per second for the disk meter.
xosview*diskWriteColor: color
This color will be used for the 1 meter to show writes.
xosview*diskReadColor: color
This color will be used for the 1 meter to show reads.
xosview*diskPriority: priority
This number (which must be an integer >= 1) sets the number of tenths of a second that the disk meter waits between updates. A value of 1 has xosview update the meter 10 times per second (the fastest). A value of 600 would cause xosview to update the meter once a minute.
xosview*diskDecay: (True or False)
If True then the disk meter will be split vertically in two. The top half will show the instantaneous state, while the bottom half will display a decaying average of the state.
xosview*diskGraph: (True or False)
If this is set to True then the disk meter will be drawn as a horizontally scrolling bargraph showing the state value verses time.
xosview*diskUsedFormat: (float, percent or autoscale)
This resource tells xosview how to display "used" labels. The formats work as follows:
float:
Display the value as a floating point number.
percent:
Display the value as a percentage of the total.
autoscale:
Display the absolute value and automatically print the units (K, M, or G) as appropriate.
xosview*diskUsedDecay: (True or False)
If True then xosview will display the used labels as an average over the last N samples. N is a vague number set at the factory. It reduces the text drawing load on the X server.
File System Meter Resources
xosview*filesys: (True or False)
If True then xosview will display a filesys meter.
xosview*filesysMounts: list
This value can be either auto or a space seperated list of mount points. If a mount point is not actually mounted then the meter will display the background using filesysNoneColor and continue to monitor the location. When a mount is made on that location then the meter will display normally. If the value of filesysMouts is auto, then meters will be created for every filesystem that has an absolute path as a source. For example "/dev/sda1 -> /" would be monitored but "tmpfs -> /tmp" would not be.
xosview*filesysFGColor: color
The filesys meter will use this color to display the used space field.
xosview*filesysBGColor: color
The filesys meter will use this color to display the free space field.
xosview*filesysNoneColor: color
The filesys meter will use this color to display the bg color when path is unmounted field.
xosview*filesysPriority: priority
This number (which must be an integer >= 1) sets the number of tenths of a second that the filesys meter waits between updates. A value of 1 has xosview update the meter 10 times per second (the fastest). A value of 600 would cause xosview to update the meter once a minute.
xosview*filesysDecay: (True or False)
If True then the filesys meter will be split vertically in two. The top half will show the instantaneous state, while the bottom half will display a decaying average of the state.
xosview*filesysGraph: (True or False)
If this is set to True then the filesys meter will be drawn as a horizontally scrolling bargraph showing the state value verses time.
xosview*filesysUsedFormat: (float, percent or autoscale)
This resource tells xosview how to display "used" labels. The formats work as follows:
float:
Display the value as a floating point number.
percent:
Display the value as a percentage of the total.
autoscale:
Display the absolute value and automatically print the units (K, M, or G) as appropriate.
RAID Meter Resources
xosview*RAID: (True or False)
If True then xosview will display a RAID meter.
xosview*RAIDdevicecount: int
Please enter your RAID device count (n) here or 0 if you don’t have any supported RAID devices. xosview then will display n RAID state displays.
xosview*RAIDdiskOnlineColor: color
xosview*RAIDdiskFailureColor: color
These colors will be used for indicating working/online or failed/offline disks. The order (from left to right) is the same as in /proc/mdstat.
xosview*RAIDresyncdoneColor: color
xosview*RAIDresynctodoColor: color
xosview*RAIDresynccompleteColor: color
If a resync/rebuild of the RAID array is in progress, the "done" and "todo" colors will be used. If no rebuild/resync is running, then the "complete" color will be shown.
xosview*RAIDPriority: priority
This number (which must be an integer >= 1) sets the number of tenths of a second that the RAID meter waits between updates. A value of 1 has xosview update the meter 10 times per second (the fastest). A value of 600 would cause xosview to update the meter once a minute.
xosview*RAIDUsedFormat: (float, percent or autoscale)
This resource tells xosview how to display "used" labels. The formats work as follows:
float:
Display the value as a floating point number.
percent:
Display the value as a percentage of the total.
autoscale:
Display the absolute value and automatically print the units (K, M, or G) as appropriate.
OBTAINING
The most current version of xosview can be found at the following site:
http://sourceforge.net/projects/xosview/
The projects source tree is also available here.
BUGS
Here is a list of known bugs. Reports of unknown bugs are appreciated and should be directed to:
https://sourceforge.net/p/xosview/_list/tickets
Bug tracking system.
AUTHORS
Mike Romberg (mike-romberg@comcast.net)
Original author, Linux and HPUX ports.
Brian Grayson (bgrayson@netbsd.org)
NetBSD port and most of the nice enhancements for version 1.4, initial work on FreeBSD port.
Scott McNab (jedi@tartarus.uwa.edu.au)
Added the scrolling graph mode.
Tom Pavel (pavel@slac.stanford.edu)
Most of the FreeBSD support, more resource-handling improvements.
Greg Onufer (exodus@cheers.bungi.com)
SunOS port.
Stefan Eilemann (eilemann@gmail.com)
IRIX 6.5 port.
Sheldon Hearn (axl@iafrica.com)
FreeBSD libdevstat-based diskmeter support.
David W. Talmage (talmage@jefferson.cmf.nrl.navy.mil)
Added battery-meter support to NetBSD.
Oleg Safiullin (form@openbsd.org)
OpenBSD interrupt-meter support.
Werner Fink (werner@suse.de)
Originator of the loadmeter.
Massimiliano Ghilardi ( ghilardi@cibs.sns.it )
Linux pagemeter.
Carsten Schabacker (cschaba@spock.central.de)
Made extensions to the serial-meter.
Paal Beyer <pbeyer@online.no>
Ported the 1 memstat kernel module to 1 -2.1
Jerome Forissier <forissier@isia.cma.fr>
Maintains the 1 SMP kernel patch which xosview uses to display meters for each cpu. This patch can be found at the following URL:
http://www-isia.cma.fr/~forissie/smp_kernel_patch/
Tomer Klainer <mandor@cs.huji.ac.il>
Initial port to BSDI.
Arno Augustin (Arno.Augustin@3SOFT.de)
Solaris disk and network meters.
Alberto BARSELLA <ishark@lsh01.univ-lille1.fr>
Fixes for 1 diskmeter + ip_chains support
Thomas Waldmann (ThomasWaldmann@gmx.de)
Linux raid meter, bitfieldmeter. Many cosmetic fixes.
Leopold Toetsch <lt@toetsch.at>
Linux lms temp meter.
David O’Brien (obrien@nuxi.com)
FreeBSD 4.* updates, and a few other suggestions.
Christos Zoulas (christos@netbsd.org)
C++ standard compliance and other NetBSD fixes.
And many others who have sent in small fixes and improvements.